Introduction
A mold designed without accurate shrinkage compensation can cost $20,000 to $80,000 in scrapped tooling, delayed launches, and emergency steel rework. For OEMs and product development teams operating on tight budgets, a single miscalculation in cavity sizing can turn a promising design into an expensive crisis.
The challenge isn't that shrinkage is unpredictable — every resin datasheet publishes a shrinkage rate. The problem is that actual part contraction is shaped by four interacting variables, and most engineers only account for one: the material's nominal shrinkage value.
This article covers the actual shrinkage formula, the four variation types that cause warpage, how process parameters shift the numbers, and how to size a cavity correctly before cutting steel. Shrinkage is predictable — if you know which variables to account for.
Key Takeaways
- Every plastic part shrinks as it cools — and predicting that shrinkage is what separates a good mold from an expensive rework
- Material type, wall thickness, packing pressure, and cooling rate each push shrinkage values in different directions
- Uneven shrinkage builds internal stress, which is what causes warpage
- Mold compensation and simulation-driven design reviews are the most reliable ways to avoid costly tooling corrections
What Shrinkage Actually Is: The Physics Behind the Contraction
Shrinkage is not a defect — it's an inherent material property. As plastic cools, polymer chains lose thermal energy and pack more tightly, causing volume reduction that must be engineered around.
This contraction happens in two phases: in-mold shrinkage (while the part is still in the cavity under pressure) and post-mold shrinkage (continuing after ejection as residual stresses relax and temperature equalizes). Both must be accounted for in toleranced part designs.
The magnitude and predictability of shrinkage depend on polymer structure:
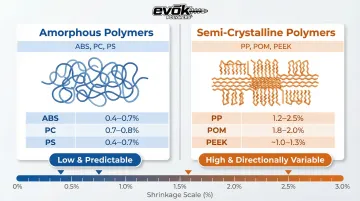
Amorphous Polymers (ABS, PC, PS) have randomly arranged molecular chains. They shrink primarily through simple thermal contraction, resulting in relatively low and predictable shrinkage:
- ABS: 0.4%–0.7%
- PC: 0.7%–0.8%
- PS (HIPS): 0.4%–0.7%
Semi-Crystalline Polymers (PP, nylon, PEEK, POM) form tightly ordered crystalline structures upon cooling. This structural phase change creates a discontinuous volume drop (visible as a distinct "kink" in the pressure-volume-temperature (pvT) curve at the crystallization temperature). The result is higher and more directionally variable shrinkage:
- PP: 1.2%–2.5%
- POM (Acetal): 1.8%–2.0%
- PEEK: ~1.0% (flow) / 1.3% (transverse)
Semi-crystalline materials are highly sensitive to cooling rates. Slower cooling allows more time for crystal formation, which increases total shrinkage — but produces more repeatable, predictable results. That predictability is what process engineers target when dialing in mold parameters.
The Shrinkage Formula: How to Calculate and Measure It
Before sizing a mold cavity, you need one equation. The standard shrinkage rate formula is:
Shrinkage (%) = [(Mold Cavity Dimension – Part Dimension) / Mold Cavity Dimension] × 100
Each variable matters:
- Mold Cavity Dimension: The steel dimension cut into the mold
- Part Dimension: The measured dimension of the cooled, ejected part
- Denominator: Always the mold dimension (not the intended part dimension)
Shrinkage is expressed in two units:
- Percentage (%): 0.5% shrinkage
- in/in (inches per inch): 0.005 in/in
Conversion: Divide percentage by 100. Example: 0.5% = 0.005 in/in.
Why Datasheets Publish Ranges, Not Fixed Numbers
Resin datasheets publish shrinkage as a range (e.g., 0.4%–0.7% for ABS vs. 1.5%–2.5% for PP) because real part shrinkage depends on wall thickness, flow direction, and processing conditions. Selecting the wrong end of that range when sizing a mold cavity is a common and costly mistake.
ASTM D955: The Baseline Test and Its Limitations
ASTM D955 is the industry standard for measuring shrinkage on a standard plaque specimen (typically 60x60x2mm). The test mandates 24–48 hours of conditioning at specified temperature and humidity before final measurement to account for post-molding shrinkage.
ASTM D955 does carry a critical limitation. The standard explicitly warns:
"Cannot predict absolute values in actual molded parts with varying flow paths, wall thicknesses, pressure and temperature gradients and process conditions."
Datasheet values are baseline indicators, not final answers. Real part shrinkage requires geometry-specific prediction — and that's where directional behavior becomes the next variable to understand.
Anisotropic Shrinkage Measurement
For fiber-filled or directionally-flow-sensitive materials, shrinkage must be measured both parallel and perpendicular to flow direction. These two values can differ dramatically. For example, DuPont Zytel 70G30L (30% glass-filled PA66) exhibits:
- Flow direction: 0.3%
- Transverse direction: 1.1%
This 3.6x difference means gate location becomes the most critical design decision to prevent warpage.
The Four Types of Shrinkage Variation That Cause Warpage
Warpage is caused by differential shrinkage. When adjacent zones shrink at different rates, the zone that shrinks less becomes the "long side" and the zone that shrinks more becomes the "short side." The resulting internal stress bows the part or creates sink marks.
Regional Shrinkage Variation
Regions near the gate (where packing pressure is highest) shrink less than areas far from the gate (where pressure is lower and the melt cools before adequate packing). This pressure gradient is a predictable, calculable source of differential shrinkage across the part footprint.
Because molten plastic is compressible, cavity pressure decays significantly from gate to end-of-fill. Regions near the gate pack denser; regions far from the gate remain under-packed and shrink more.
Through-Thickness Shrinkage Variation
The outer skin of the part contacts the mold wall and cools rapidly, while the core material cools slowly. This thermal gradient means skin and core contract at different rates, creating a stress layer that can bow or warp thin walls.
If the core and cavity halves are held at different temperatures, the plastic cools at different rates from side to side, creating a bending moment that bows the part toward the hotter side.
Directional Shrinkage Variation (Flow vs. Crossflow)
Polymer chain and fiber orientation along the flow direction causes shrinkage parallel to flow to be lower than shrinkage perpendicular to flow.
DuPont Zytel 70G30L illustrates how severe this can get: it shrinks just 0.3% parallel to flow but 1.1% transverse to flow. Engineers use mold flow simulation to predict fiber alignment and place gates to orient fibers along critical dimensions.
In-Plane vs. Through-Thickness Shrinkage Variation
Flat or plaque-like parts can shrink differently in-plane versus through their thickness due to constraint from the mold wall. This effect is most pronounced when parts include:
- Ribs or bosses that locally constrain shrinkage while surrounding walls contract freely
- Non-uniform cross-sections where thick and thin zones cool at different rates
- Large flat faces where in-plane constraint from the mold creates stress gradients through the thickness
The Five Process Variables That Shift Your Shrinkage Numbers
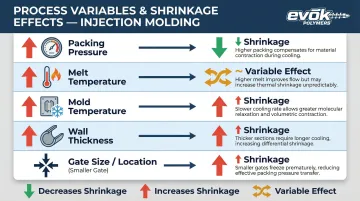
While material selection sets the baseline, actual dimensions are dictated by processing parameters. The table below summarizes the directional effect of each variable before diving into the mechanics behind each one.
| Process Variable | Direction | Primary Mechanism |
|---|---|---|
| Packing pressure | ↑ pressure → ↓ shrinkage | More material forced into cavity; less void for polymer relaxation |
| Melt temperature | ↑ temp → variable effect | Lower viscosity aids packing; greater thermal mass increases cooling load |
| Mold temperature | ↑ temp → ↑ shrinkage | Slower cooling enables fuller crystallization in semi-crystalline materials |
| Wall thickness | ↑ thickness → ↑ shrinkage | Thicker walls retain heat longer, allowing more volumetric relaxation |
| Gate size/location | Smaller gate → ↑ shrinkage | Early freeze-off cuts packing pressure before cavity is fully compensated |
Packing Pressure and Packing Time
Increasing packing pressure forces more material into the cavity, reducing the void available for polymer chains to relax into. This is the single most powerful process-level knob for shrinkage control. Holding pressure compensates for thermal contraction until gate freeze-off occurs.
Under-packing is one of the most common root causes of out-of-tolerance dimensions. Gates must be sized appropriately to prevent premature freeze-off, ensuring packing pressure can act on the melt long enough to stabilize dimensions.
Melt Temperature
Higher melt temperatures create lower-viscosity material that packs more easily and allows better molecular relaxation. However, they also increase the thermal mass that must dissipate before the part solidifies. Whether shrinkage goes up or down depends on which factor dominates: if packing benefits outweigh the added cooling load, shrinkage decreases — and vice versa.
Mold Temperature
A hotter mold allows slower, more uniform cooling, giving semi-crystalline materials more time to crystallize fully. This actually increases shrinkage in crystalline polymers (like PP or nylon) but produces more consistent, predictable results than a fast quench. A cold mold quenches the part quickly, freezing in less crystallinity and producing lower but less uniform shrinkage.
Wall Thickness
Thicker walls cool more slowly, hold heat longer, and allow more crystallization and volumetric relaxation. The relationship between wall thickness and shrinkage is non-linear, which matters during part design. Abrupt thick-to-thin junctions are a primary source of regional differential shrinkage — and the warpage or sink that follows.
Gate Size and Location
Gate size controls how long the packing phase can act on the melt. An undersized gate freezes off early, cutting off packing pressure before the cavity is fully compensated and raising shrinkage in regions downstream. Gate location determines which flow paths are long versus short, directly setting up where regional shrinkage differences will appear on the finished part.
How to Compensate for Shrinkage When Sizing a Mold Cavity
To produce a plastic part to exact dimensional specifications, the mold cavity must be machined larger than the desired part.
The Compensation Formula
Mold Dimension = Part Dimension / (1 – Shrinkage Rate)
Worked Example: If a part feature must measure exactly 100.00mm, and the material has a predicted linear shrinkage rate of 1.5% (0.015):
100.00mm / (1 – 0.015) = 100.00 / 0.985 = 101.52mm
(Note: Simply multiplying 100 × 1.015 yields 101.50mm, which introduces a slight mathematical error that compounds on larger parts.)
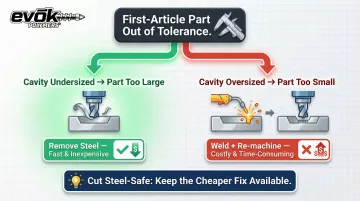
The "Steel-Safe" Strategy
Because exact shrinkage is influenced by complex interactions between geometry and processing, first-off molded parts rarely hit every tolerance perfectly. The standard approach is to cut mold cavities slightly undersized. The cost difference between the two correction paths makes this non-negotiable:
- Cavity undersized → part too large: Remove a few thousandths of steel. Fast, inexpensive.
- Cavity oversized → part too small: Weld new steel into the cavity, then re-machine. Costly and time-consuming.
Cutting steel-safe keeps the cheaper correction path open.
Anisotropic Compensation
For parts with strict tolerances in both flow and cross-flow directions (common in medical, semiconductor, or precision consumer parts), the mold may need to be dimensioned differently in each axis. This is where generic datasheet shrinkage values break down and material-specific, geometry-specific prediction is required.
Predicting Shrinkage Before You Cut Steel: Simulation and Expert Design Reviews
What Mold Flow Simulation Actually Calculates
Modern mold flow simulation (Moldflow-type analysis) models the pvT (pressure-volume-temperature) relationship of the specific resin through the fill, pack, and cooling phases. As melt pressure and temperature drop during cooling, the specific volume of the polymer changes in a material-specific way that determines local shrinkage.
The software produces spatially resolved shrinkage predictions across the part surface, not a single average number. By calculating the exact pressure and temperature history at every node in the 3D mesh, it determines localized volumetric shrinkage, accounting for pressure decay from gate to end-of-fill.
What a Pre-Molding Design Review Catches
A pre-molding design review identifies critical issues before tooling is committed:
- Differential shrinkage hotspots driven by wall thickness transitions
- Gate placement that creates long flow paths with inadequate packing
- Rib geometries that create through-thickness shrinkage conflicts
Catching these issues on screen costs a fraction of what a tool modification costs post-steel. EVOK integrates mold flow analysis into part design — not just as a final tool validation step — so shrinkage conflicts get resolved before cavity dimensions are ever committed to steel.
The Practical Workflow
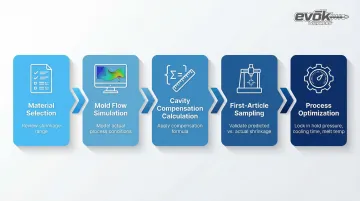
Running a design review in isolation isn't enough. The steps below show how simulation, measurement, and process tuning work together to manage shrinkage end-to-end:
- Material selection → Review datasheet shrinkage range
- Mold flow simulation → Model actual process conditions
- Mold cavity compensation calculation → Apply the correct compensation formula to offset predicted shrinkage in cavity dimensions
- Prototype tool or first-article sampling → CMM measurement to validate predicted vs. actual shrinkage at critical features
- Process parameter optimization → Lock in hold pressure, cooling time, and melt temperature before production release
Teams that skip steps 1–3 typically discover shrinkage errors at first-article — after steel is cut, after schedule has slipped, and after the cheapest fixes are off the table.
Frequently Asked Questions
What is the standard formula for calculating injection molding shrinkage?
The formula is: [(Mold Cavity Dimension – Part Dimension) / Mold Cavity Dimension] × 100. The mold dimension is the denominator, and the result can be expressed as a percentage or as in/in by dividing by 100.
How does wall thickness affect shrinkage in injection molded parts?
Thicker walls cool more slowly, allowing more volumetric relaxation and crystallization, which increases shrinkage. Abrupt thickness changes within a single part are a primary cause of differential shrinkage and warpage.
What is the difference between amorphous and semi-crystalline shrinkage rates?
Amorphous polymers (ABS, PC) typically shrink 0.3%–0.7% more uniformly. Semi-crystalline polymers (PP, nylon) shrink 1.0%–3.0% with greater directional variation due to crystallite formation during cooling.
What does "steel safe" mean when designing a mold for shrinkage?
"Steel safe" means intentionally sizing the mold cavity at the tighter end of the expected shrinkage range. If the part comes out slightly oversized, you can correct it by removing steel from the cavity — far less costly than adding steel back to a cavity that was cut too large.
Can mold flow simulation accurately predict shrinkage?
Modern mold flow simulation uses pvT material data to model shrinkage spatially across the part. It is far more accurate than using a single datasheet value, but validation with a first-article measurement is still recommended for tight-tolerance applications.
Why does shrinkage cause warpage even when overall shrinkage is within spec?
Warpage is caused by differential shrinkage. When adjacent zones shrink at slightly different rates — due to pressure differences, wall thickness variation, or flow orientation — internal stress builds unevenly. That stress bows or twists the part even when the average shrinkage looks acceptable.