Introduction
Injection molding engineers face a persistent challenge: setting hold time by gut feel or outdated rules of thumb. This approach either leaves cycle time bloated—costing thousands in lost machine capacity—or risks part defects like sink marks, voids, and dimensional variation.
Adding just 1 second of unnecessary hold time on a 10-second cycle consumes 800 hours of machine capacity annually, costing approximately $38,800 in machine rates and lost opportunity, according to Plastics Technology.
A gate freeze study (also called a gate seal study) is the data-driven method that solves this problem. This guide walks through exactly how to run one—from equipment setup and shot weight measurements to interpreting your data and locking in the optimal hold time for your process.
Key Takeaways
- A gate freeze study determines the minimum hold time needed to prevent backflow through the gate after packing
- Run the study by incrementally increasing hold time while measuring shot weight, then plot weight versus hold time
- Part weight stabilizes at the gate freeze point — that's your target
- Set hold time just above the freeze point to ensure consistent fill without over-packing
- Applies to cold runner, hot runner, and valve-gated systems — though the weight curve shape differs by gate type
- Minimum viable hold time reduces overall cycle time; pair it with adjusted cooling time to capture the full savings
What Is a Gate Freeze Study — And Why Cycle Time Depends on It
Defining Gate Freeze and Its Impact on Production
Gate freeze (also called gate seal) is achieved when the mold is totally filled and the material at the gate solidifies, meaning no more material can flow into or exit the cavity. A gate freeze study is technically a hold-time study—the goal is stable, repeatable parts, not just confirming that the gate freezes.
Hold time is one of the longest-running segments in the injection cycle, which makes it one of the fastest places to lose money. According to industry analysis, a 5-second difference in cycle time equates to $55,000 annually in machine costs and lost capacity. At high volumes, even 1–2 seconds of excess hold time across multiple presses compounds quickly into a significant cost problem.
When This Study Belongs in Your Process
Given those stakes, timing this study correctly matters. Run it after fill speed optimization and cavity balance verification — not before. Prerequisites before you start:
- Cavity weight variation must be below 5%
- Multi-cavity tools must demonstrate 95% balance (less than 5% part weight difference) before testing begins
- The study must be completed before the process is finalized for production
What to Have Ready Before You Run a Gate Freeze Study
Lock In Process Conditions First
Before the study begins, lock in these conditions to ensure repeatable, comparable data points:
- Melt temperature set to resin manufacturer's recommended mid-range
- Mold temperature at mid-range
- Fill speed confirmed from viscosity study
- Dosing stroke and transfer position recorded and held constant
The Cooling-Time Compensation Rule
As hold time is incrementally increased during the study, cooling time should be decreased by the same increment to maintain a consistent overall cycle time. This is a commonly skipped step that skews results and makes data harder to interpret. For example, if you add 1.5 seconds to hold time, remove 1.5 seconds from cooling time.
Skipping this step compresses cooling time unevenly across the data set, making it nearly impossible to pinpoint the true gate freeze point.
Equipment and Measurement Requirements
You'll need:
- Precision scale capable of measuring to 0.01 grams or better
- Data log or table to record hold time and corresponding shot weights
- Qualified operator familiar with the specific press
How to Conduct a Gate Freeze Study — Step by Step
Step 1 – Set Initial Hold Pressure and Hold Time
Set hold pressure high enough to eliminate sink marks but not so high that the part is overpacked or difficult to eject. A starting hold time can be estimated from operator experience and multiplied by 1.5 as a conservative starting point.
Step 2 – Collect and Weigh Baseline Shots
At the initial hold time setting:
- Collect 3 consecutive shots
- Weigh each to 0.01 gram precision
- Calculate the average
Consecutive shots matter — individual outliers can occur during machine settling, so the average is what counts.
Step 3 – Increment Hold Time, Decrement Cooling Time
Reduce hold time by a set increment and simultaneously increase cooling time by the same value to preserve total cycle time. Record the new settings in the data table.
Increment sizes:
- Small parts: 0.5 seconds
- Larger parts: 1–2 seconds
Step 4 – Repeat Until Part Weight Drops
Collect 3-shot sets at each hold time increment, averaging the weight each time. Once part weight begins to decrease, the gate is no longer frozen and backflow is occurring — that's your signal to stop.
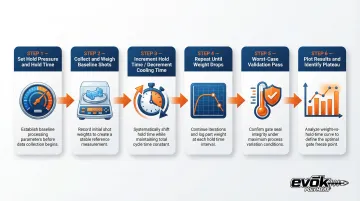
Step 5 – Run a Worst-Case Validation Pass
After identifying the gate freeze point under standard conditions, repeat the test at elevated melt temperature and elevated mold temperature. This worst-case scenario documents the maximum hold time needed across your full processing window. It's a step many shops skip — and then run into trouble when seasonal temperature swings or a new material lot shifts their process conditions.
Step 6 – Plot Results and Identify the Plateau
Plot shot weight versus hold time on a graph. You'll see two zones:
- Rising region (left): Small changes in hold time cause large weight changes
- Plateau region (right): Weight stabilizes, indicating gate freeze has occurred
Hold time should be set at or slightly above the plateau point, not at the exact edge. Setting hold time exactly at the identified gate-freeze edge guarantees that normal thermal fluctuations will cause intermittent unsealed gates.
Interpreting Your Results and Setting Optimal Hold Time
Standard Cold Runner Behavior
For a cold runner mold, the weight curve rises then flattens to a clear plateau. The plateau means no melt is entering or leaving the cavity. Read the gate freeze time from the x-axis where the curve flattens.
A ~20% safety margin (or 1–2 seconds) must be added to the established cold-runner gate seal time to account for process variations.
Hot-Runner and Oversized Gate Curves
Hot-runner molds, thermally gated hot tips, or cold runners with oversized gates produce a non-flat curve. Weight continues to rise incrementally past the expected plateau because the gate does not fully freeze in the traditional sense.
In these cases, the test objective shifts from finding a flat plateau to finding where the rate of weight increase stabilizes. Stability is reached when three consecutive hold-time increments result in a weight increase below 0.5%.
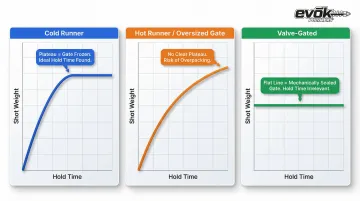
Valve-gated systems follow a different logic entirely — mechanical closure replaces thermal freeze as the control mechanism.
Valve-Gated Hot-Runner Behavior
Since the gate is mechanically closed, there is no traditional freeze curve. The study remains useful because pneumatic valve actuation introduces timing variation — a valve gate can take up to 0.2 seconds to close, risking backflow if hold pressure drops too early. A very short hold time amplifies any inconsistency in valve closure timing, directly affecting part weight and dimensions.
Cycle Time Optimization Decision
Once the gate freeze time is identified:
- Set hold time slightly above the plateau (for cold runners)
- Confirm that the corresponding adjusted cooling time is still sufficient for parts to eject without distortion
- Document the validated hold time in your process parameter sheet as the confirmed production baseline
Common Interpretation Errors to Avoid
- Accepting a plateau too early — confirm you are past the rising region before recording freeze time
- Stopping data collection at the plateau without running additional points to verify stability
- Averaging shot weights across cavities without checking individual cavity variation in multi-cavity tools
Gate Freeze Beyond the Gate — Other Factors That Limit Packing
Part Geometry Freeze-Off
The part geometry can freeze before the gate. Thin wall sections, living hinges, or narrow flow paths between thick regions can solidify first, cutting off packing pressure to portions of the part even while the gate remains open.
Weighing runners separately from the part during the study helps diagnose whether the packing limitation is in the feed system or the part itself. Two patterns to watch for:
- Part and runner weights level off together — the feed system is freezing first and limiting packing
- Part weight plateaus while runner weight continues rising — freeze-off is occurring within the part geometry itself
Separating these two weight curves is a reliable way to localize where packing is being cut off.
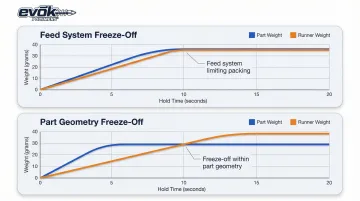
Feed System Freeze-Off
A separate but related failure mode occurs when the sprue or runner is undersized relative to the gate — it solidifies before the gate freezes. This artificially limits packing and causes the weight curve to plateau prematurely, masking the true gate freeze time. Without separating runner and part weights, this error can go undetected and lead to an incorrectly short pack time.
The Diagnostic Value of Simulation
Mold flow analysis can identify freeze-off sequencing across the sprue, runner, gate, and part geometry before running physical shots. Simulation typically assumes isothermal conditions and returns a best-case (shorter) gate freeze estimate — meaning physical shot data will almost always show a longer freeze time than the model predicts. Treat simulation output as the floor, not the target.
How Evok Polymers Helps Optimize Your Injection Molding Cycle Time
Scientific Molding and Process Development Partnership
Evok Polymers is a scientific molding and process development partner with 25 years of injection molding expertise. Built on a philosophy of data-driven part development, Evok applies structured studies — including gate freeze, viscosity, and cavity balance — to establish repeatable, optimized processes before quality issues reach the production floor.
Founder Paul Dathe has over 25 years of experience in engineering, product design, and solving problems in injection molding custom plastic components. His credentials include:
- Four U.S. utility patents in plastic component design
- Six Sigma black belt certification
- Track record spanning OEMs in powersports, semiconductor, medical devices, and packaging
Upfront DFM and Process Optimization
Evok's upfront design for manufacturability (DFM) and process optimization work directly reduces long-term cycle time and part cost. By integrating gate freeze studies into tool validation, Evok helps OEMs and product manufacturers avoid oversized hold times, excess scrap, and dimensional instability at volume.
Every second removed from cycle time has a direct financial impact:
- More parts produced per shift
- Lower per-unit cost at volume
- Shorter lead times from tool validation to production
Ready to Optimize Your Process?
If you're an OEM or product developer looking to validate a new tool or optimize an existing injection molding process, Evok's team will work with you. Contact Evok at +1 612-991-2001 or visit their website to discuss how structured process development can reduce your cycle time and improve part quality.
Frequently Asked Questions
What is the difference between a gate freeze study and a gate seal study?
Gate freeze and gate seal refer to the same phenomenon and are used interchangeably. The study is sometimes called a hold-time study because its true objective is establishing a stable, data-backed hold time regardless of whether a true freeze occurs.
Does a gate freeze study apply to hot-runner or valve-gated molds?
Yes, the study applies to all runner systems. The curve shape will differ (no true flat plateau in hot-runner or valve-gated systems), but the study still identifies the stable operating range for hold time needed to produce consistent part weights.
How does a gate freeze study reduce injection molding cycle time?
By finding the minimum hold time required for gate freeze, the study eliminates excess seconds of hold time that inflate every cycle. The corresponding cooling time is adjusted to compensate, resulting in a tighter, faster cycle without sacrificing part quality.
What happens if hold time is set too short?
The gate is not frozen when hold pressure drops, allowing melt to flow back through the gate. This results in inconsistent shot weight, sink marks, voids, and dimensional variation from shot to shot.
How often should a gate freeze study be repeated?
Repeat the study whenever a significant process variable changes: new resin lot, material change, mold modification, or press transfer. Gate freeze time is sensitive to melt temperature, mold temperature, and gate geometry, so any of these shifts can invalidate a prior result.
Can mold flow simulation replace a physical gate freeze study?
Simulation provides a useful starting point and can identify freeze-off sequencing issues before physical trials, but it assumes idealized conditions and typically underestimates real-world gate freeze time. A physical study on the actual tool is always required for final process validation.