Introduction
Every second your injection molding machine runs costs money. Cycle time—the single most controllable factor in per-part manufacturing cost—directly determines whether you're maximizing profit or hemorrhaging cash. Research shows that a 10-second reduction in a 60-second cycle can generate over $50,000 in additional annual profit per machine, while a seemingly minor 2-second increase can cost approximately $40,000 in lost profit annually.
Longer cycles mean fewer parts per hour, higher labor allocation per part, and reduced machine utilization. While cycle times typically range from 10 seconds for thin-wall packaging to 120+ seconds for thick technical components, the economics are clear.
Yet industry data reveals that most molders operate 20-40% slower than optimal due to poor design decisions, inadequate cooling strategies, or process inefficiencies locked in before the first part is molded.
This inefficiency compounds rapidly across production volumes. For manufacturers producing millions of parts annually, every excess second translates to thousands of dollars in wasted capacity—money that strategic design collaboration and process optimization could have saved before tooling investment.
Key Takeaways
- Cycle time is the primary controllable driver of injection molding cost per part
- Cooling accounts for 60-80% of total cycle time, making thermal management the highest-impact optimization target
- Optimize at three points: design phase (before tooling), process tuning (during production), or equipment upgrades
- 25% cycle time reduction adds $50,000-$150,000 annual capacity value per machine
- Per-part costs drop 15-20% with optimized cycle times
- Design phase decisions lock in most cycle time waste—early moldability collaboration is critical
How Cycle Time Costs Build Up in Injection Molding
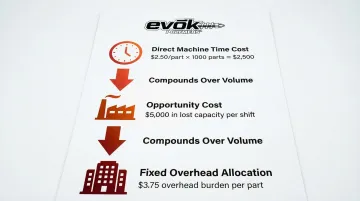
Cycle time costs build up quietly across three economic dimensions that compound over production volumes.
Direct machine time cost is the most obvious: your per-part cost equals machine hourly rate divided by parts produced per hour. A machine running at $60/hour producing 100 parts/hour costs $0.60 per part in machine time alone.
Reduce the cycle by 20% and the same machine now produces 125 parts/hour, dropping machine cost to $0.48 per part—a 20% reduction.
Opportunity cost represents the parts you could have produced but didn't. A 5-second excess on a 45-second cycle running 1 million parts annually consumes an additional 1,389 machine hours—capacity worth $55,000 at a $40/hour machine rate.
This "hidden factory" of lost capacity often goes unnoticed in traditional cost accounting.
Beyond lost production capacity, longer cycles impact your fixed costs.
Fixed overhead allocation spreads costs like facility rent, utilities, and supervision across fewer parts when cycles run long. Each part carries a higher burden of these fixed costs, eroding margins even when material and labor costs remain constant.
These costs compound ruthlessly over volume. What seems like an insignificant 5-second delay per part becomes hundreds of lost production hours annually, translating to five- and six-figure profit erosion that most manufacturers unknowingly accept because molders quote based on historical performance rather than optimized potential.
Key Cost Drivers for Injection Molding Cycle Time
Understanding where time is consumed in the molding cycle reveals where optimization efforts deliver maximum return.
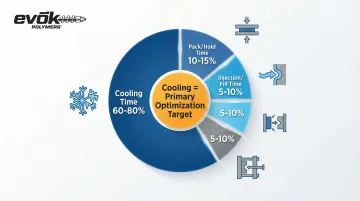
The four cycle time components:
- Cooling time (60-80%) – Time for plastic to solidify enough to withstand ejection
- Injection/fill time (5-10%) – Time to fill the cavity with molten plastic
- Pack/hold time (10-15%) – Pressure application to compensate for shrinkage
- Mold open/close/eject (5-10%) – Mechanical machine movements
Cooling time dominates because heat transfer follows physical laws that can't be rushed without consequence. Cooling time is proportional to wall thickness squared—meaning a part with 4mm walls takes roughly four times longer to cool than a 2mm wall part of the same material.
This squared relationship makes part geometry the single most important cycle time driver.
Other Factors That Impact Cycle Time
While cooling dominates, these factors also shape total cycle time:
- Mold design – Gate location affects flow length and pressure requirements; cooling channel efficiency determines heat extraction speed
- Material thermal properties – Thermal diffusivity varies significantly; polypropylene cools approximately 30% faster than polycarbonate at equivalent thickness
- Machine capabilities – Injection speed capacity, clamp speed, and dry cycle time
- Process settings – Melt temperature, mold temperature, and injection speed parameters
For most parts, approximately half of production cost is raw material. The other half relates directly to machine time, making cycle efficiency the primary lever for cost reduction after material selection is finalized.
Cost-Reduction Strategies for Injection Molding Cycle Time
Cycle time optimization requires strategic intervention at three distinct stages: design decisions before tooling investment, process management during production, and infrastructure improvements through equipment and tooling upgrades.
Strategies That Reduce Cycle Time by Changing Design Decisions
Design decisions made before tooling is cut determine the theoretical minimum cycle time—these choices deliver the highest impact at the lowest cost.
Optimize wall thickness uniformity and minimize maximum thickness:
- Every 1mm increase in wall thickness roughly quadruples cooling time
- Design for uniform walls between 1.5-3mm when possible to balance strength and cooling efficiency
- Eliminate thick sections that create thermal bottlenecks dictating overall cycle time
- Thick bosses and ribs create hot spots that extend cooling; design ribs at 50-60% of nominal wall thickness
- Boss wall thickness should not exceed 75% of main wall to avoid thermal mass accumulation
Design for efficient heat extraction through strategic geometry:
- Rib height should be limited to 3 times rib thickness for adequate cooling access
- Space ribs at least 2.5-3 times nominal wall thickness apart to allow heat removal
- Core out thick sections wherever structural requirements permit
- Consider part orientation in the mold to optimize cooling channel proximity to thick areas
Specify materials with favorable thermal properties:
Materials with higher thermal diffusivity transfer heat faster, enabling shorter cycles. Polypropylene cools approximately 30% faster than polycarbonate at equivalent wall thickness.
Glass-filled resins cool faster than unfilled variants due to enhanced thermal conductivity, while semi-crystalline materials generally outpace amorphous polymers.
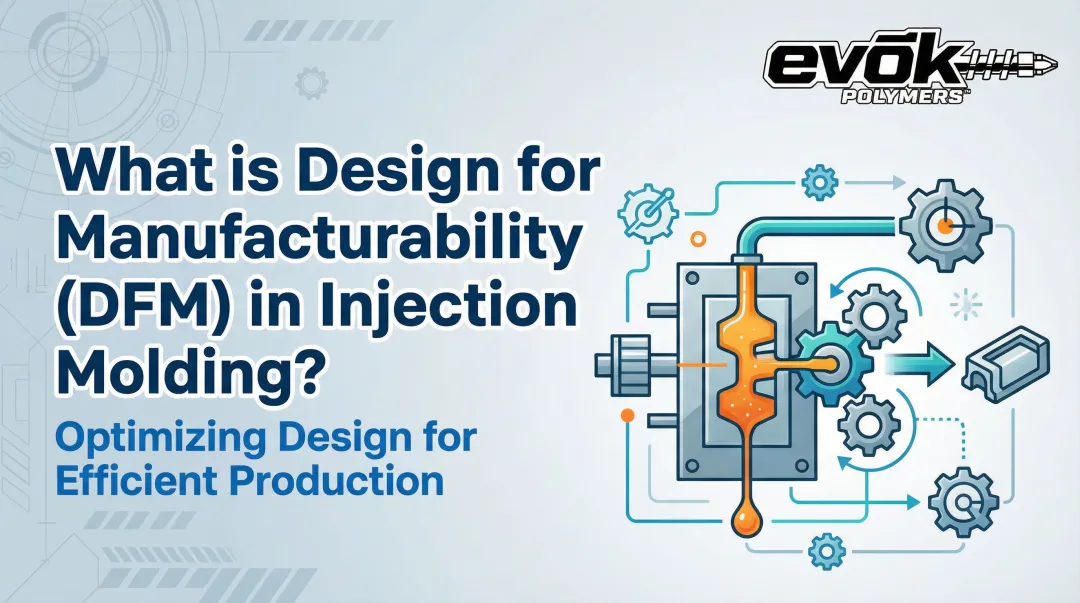
Engage molding partners early in design phase:
Early Design for Manufacturability (DFM) collaboration can reduce cycle times by 20-40% without compromising part performance. Roughly 70% of manufacturing costs are determined during design, making this the highest-leverage intervention point.
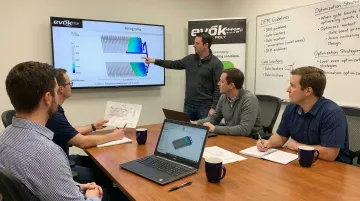
Experienced molding partners identify cycle time optimization opportunities during design review through comprehensive mold flow analysis and thermal management strategies. Evok's 25+ years of tooling expertise means these modifications happen when they're most cost-effective—before tooling is cut.
Strategies That Reduce Cycle Time by Changing Process Management
Once tooling exists, scientific process management extracts maximum performance from the installed equipment.
Optimize cooling phase through temperature management:
Set mold temperature at the maximum that maintains part quality and dimensional stability. Every 10°C increase can reduce cycle time by 10-15%, though this must be balanced against warpage risk.
In one documented case, reducing mold temperature from 50°C to 40°C in a polypropylene application reduced cooling time by 22%.
Reduce melt temperature to minimum functional level:
Excessive melt temperature requires longer cooling to reach ejection temperature. Reducing melt temperature by 20°C can save 2-4 seconds on a 30-second cycle.
The key is finding the minimum temperature that ensures complete fill and adequate packing without creating short shots or poor surface finish.
Increase injection speed to maximum quality threshold:
Faster injection reduces time for heat transfer to the mold during fill, shortening overall cooling requirements. Push injection speed to the maximum that avoids cosmetic defects, burn marks, or excessive shear heating. For shear-sensitive materials like PVC, balance speed against material degradation risk.
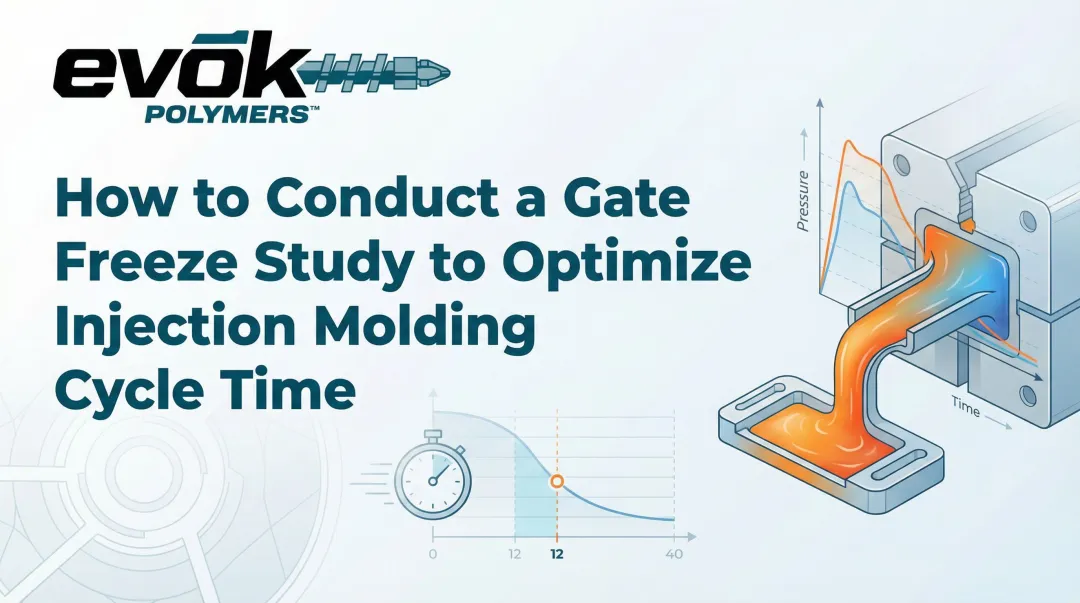
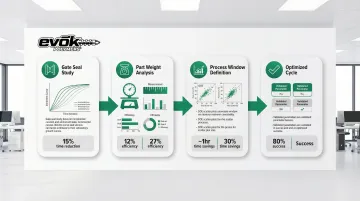
Implement scientific molding principles:
Gate seal studies identify the exact moment the gate freezes, eliminating unnecessary pack/hold time. Many molders use excessive hold time as a safety margin; precise gate seal studies can reduce hold time by 30-50% with zero capital investment.
This methodology involves incrementally reducing holding time and weighing parts—once part weight stabilizes, additional hold time is waste. Scientific molding using cavity pressure sensors and Design of Experiments (DOE) creates robust process windows. These windows enable faster cycles without compromising repeatability.
Strategies That Reduce Cycle Time by Changing Tooling and Equipment Context
When design and process optimization have been exhausted, advanced tooling technologies and equipment upgrades deliver step-change improvements.
Invest in conformal cooling channels:
Conformal cooling channels follow part geometry rather than using straight-drilled lines, reducing cooling time by 30-50% compared to conventional approaches. In complex geometries, reductions up to 66% have been documented.
Manufacturers often create these channels through additive manufacturing, ensuring uniform heat removal and eliminating hot spots that dictate cycle time. The technology is particularly valuable for parts with complex geometries where traditional cooling access is limited.
Upgrade to faster machine technology:
Electric toggle machines reduce dry cycle time (mold open/close/eject) by 25-35% compared to hydraulic machines. Electric systems achieve mold movement speeds 30-50% faster than hydraulic equivalents while offering superior repeatability (±0.01mm).
For high-volume production, these speed improvements translate directly to capacity gains with significantly lower energy consumption.
Implement hot runner systems:
Hot runners eliminate the need to cool and eject thick runner systems, reducing cycle time by 15-25% while eliminating material waste and regrind requirements. The investment is particularly justified for high-volume production where material savings and cycle time reduction compound over millions of parts.
Partner with molding specialists who optimize tooling from the start:
Evok's cross-functional team and 25 years of tooling experience mean molds are designed with optimized cooling channels, strategic gate locations, and efficient ejection systems that minimize cycle time from the first shot.
Their systematic approach includes wall thickness modifications, gate sizing optimization, and vent placement strategies developed during T1 trials. This upfront expertise achieves the fastest possible cycles while maintaining part quality—preventing costly inefficiencies that become permanent once production tooling is finalized.
Conclusion
Cycle time optimization is not about blindly cutting seconds from the cycle—it's about strategically identifying where time is wasted relative to the theoretical minimum dictated by part geometry and material thermal properties.
The greatest cost-reduction opportunities exist in the design phase before tooling is cut, where decisions about wall thickness, rib design, and material selection determine 60-80% of final cycle time.
Engaging experienced molding partners like Evok Polymers early enables design decisions that reduce cycle time by 30-50% compared to designs created without moldability input. This collaborative approach leverages deep industry knowledge to optimize part geometry, material selection, and tool design before production tooling is cut.
Once tooling exists, scientific process management and strategic equipment investments can further optimize performance, but these gains are incremental compared to the foundational improvements achieved through design collaboration.
For manufacturers seeking competitive advantage through lower per-part costs and increased capacity, cycle time optimization represents one of the highest-return investments available—particularly when addressed at the stage where changes cost the least and deliver the greatest impact.
Frequently Asked Questions
What is the typical cycle time for injection molding?
Typical cycle times range from 10-20 seconds for thin-wall packaging, 20-45 seconds for general consumer products, and 45-120+ seconds for thick-walled technical parts. Cooling time represents 60-80% of the total cycle.
How do I calculate injection molding cycle time?
Cycle time equals cooling time + injection time + pack/hold time + mold open/close time. Cooling time is estimated as (wall thickness in mm)² × material factor (0.8-2.0). Production rate = 3,600 seconds/hour ÷ cycle time.
How to reduce cycle time in injection molding?
Optimize part design for uniform thin walls before tooling (highest impact), improve mold cooling through conformal channels or optimized layout (requires tooling investment), and fine-tune process parameters like mold temperature and injection speed during production (lowest cost).
What percentage of injection molding costs come from cycle time?
A 25% cycle time improvement reduces per-part cost by 15-20% while increasing annual capacity value by $50,000-$100,000 per machine. Since machine time represents approximately half of total part cost, cycle efficiency is the single largest variable cost factor.
Does faster cycle time affect part quality?
Properly optimized cycle time improves quality through uniform cooling. However, cutting below minimum cooling requirements causes sink marks, voids, and warpage. Scientific optimization using gate seal studies enables faster cycles without quality compromise.
How much can cycle time optimization save annually?
Reducing a 40-second cycle to 30 seconds on a machine running 6,000 hours/year adds 180,000 parts of annual capacity. This represents $50,000-$150,000 in additional capacity value, plus 15-20% reduction in per-part costs.