Introduction
Picture this: An OEM engineer submits a new mold for first article inspection. The dimensional report comes back clean—every measurement falls within specification. Yet the quality team flags the submission with a single line: "Process not capable." The parts pass, but the process fails.
This scenario plays out daily in injection molding facilities worldwide. Individual parts can measure perfectly within tolerance while the underlying process lacks the consistency to sustain that performance across thousands or millions of shots. That gap between part conformance and process capability is where production launches stall, defect rates hide, and the 1.33 Cpk requirement becomes the deciding factor.
TLDR
- Cpk quantifies process consistency, not just whether individual parts pass inspection—it predicts how reliably your process will hold spec at production scale
- Automotive and OEM programs require 1.33 Cpk, providing a 4-sigma buffer that statistically limits defects to ~63 parts per million
- Achieving 1.33 requires upstream decisions in part design, material selection, tooling, and process setup. Inspection alone cannot create capability
- Verification demands 30+ consecutive parts per cavity, calibrated measurement systems (Gage R&R), and proper statistical analysis before production release
What Is Cpk in Injection Molding—and Why 1.33 Is the Industry Standard
Understanding Process Variation as a Statistical Reality
Injection molded parts exhibit shot-to-shot dimensional variation even with locked machine settings and stable material lots. Plastic flow, cooling rates, and molecular packing create a natural distribution of measurements around a mean value. The question is not whether variation exists, but whether it's narrow enough—and centered well enough—to reliably stay within specification limits.
Defining Cp: Theoretical Capability Without Centering
The Capability Index (Cp) measures whether your process spread theoretically fits within the tolerance band:
Cp = (USL − LSL) / 6σ
Where USL is the upper specification limit, LSL is the lower specification limit, and σ is the process standard deviation. Cp assumes perfect centering. A Cp of 1.33 means the tolerance band is 1.33 times wider than the natural process spread (6 standard deviations). But Cp ignores a critical factor: where the process mean actually sits relative to those limits.
Cpk: What Happens When the Mean Isn't Centered
Cpk accounts for both spread and centering by measuring the distance from the process mean to the nearest specification limit:
Cpk = min[(USL − X̄)/3σ, (X̄ − LSL)/3σ]
Cpk is always less than or equal to Cp. A process can have excellent repeatability (high Cp) but still fail Cpk if the mean is biased toward one tolerance limit—often the result of tooling cut off-center or inadequate pack pressure shifting dimensions consistently high or low.
Why 1.33 Cpk Is the Threshold
At Cpk = 1.33, the process mean sits at least 4 standard deviations away from each spec limit. Statistically, this yields approximately 63 parts per million (PPM) out of spec. Here's how that compares across capability levels:
| Cpk Level | σ Buffer | Defect Rate (PPM) | Typical Application |
|---|---|---|---|
| 1.00 | 3σ | ~2,700 | Minimally capable; high reject risk |
| 1.33 | 4σ | ~63 | AIAG PPAP baseline; production approval |
| 1.67 | 5σ | ~0.54 | Safety-critical and medical applications |
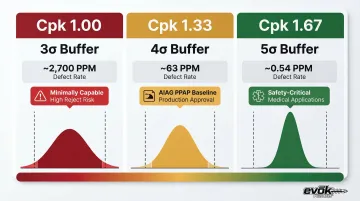
AIAG PPAP standards mandate Cpk ≥ 1.33 as the baseline for production approval, with values between 1.33 and 1.67 requiring customer review and anything below 1.33 triggering corrective action or 100% inspection.
The Business Stakes
OEMs in automotive, medical devices, and powersports specify 1.33 minimum Cpk for critical dimensions because passing piece-by-piece inspection does not guarantee production consistency. Parts that measure in-spec during first article can still come from a process that will statistically deliver out-of-spec parts to customers at an unacceptable rate. That's why Cpk is required before production release—not as a formality, but as a forward-looking guarantee that the process will hold tolerance across thousands of shots, not just the first hundred.
How to Identify Which Dimensions Are "Critical" for Cpk Measurement
Not Every Dimension Requires Cpk Verification
Applying Cpk requirements universally inflates cost and delays launch timelines. The key is distinguishing critical dimensions—those affecting function, fit, assembly, or safety—from reference dimensions and cosmetic features. Only dimensions where out-of-spec parts cause functional failure or assembly rejection qualify as Critical-to-Quality (CTQ).
Defining Critical-to-Quality (CTQ) Characteristics
Trace each dimension back to its functional consequence:
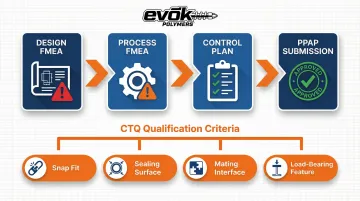
- Does it control a snap fit that must engage reliably?
- Does it define a sealing surface where leakage would occur if undersized?
- Does it govern a mating interface with another component?
- Does it support a load-bearing feature where structural failure is a risk?
If the answer is yes, it's CTQ. Dimensions used for reference, assembly guidance, or cosmetic appearance still need process control — they just don't require Cpk targets, which keeps your inspection plan lean without dropping coverage.
Location-Based Vulnerability to Variation
Once you've identified which dimensions are functionally critical, the next question is where they sit on the part — because geometry and flow path directly affect how much variation you can expect.
Not all dimensions are equally achievable. Certain geometric locations are inherently susceptible to shot-to-shot variation:
| Vulnerable Location | Why Variation Increases |
|---|---|
| End-of-fill areas | Pressure drop and premature freezing reduce consistent packing |
| Thin wall sections | Rapid freeze-off restricts pack pressure from reaching thicker areas |
| Across weld lines | Flow front convergence creates localized cooling and fiber orientation differences |
| Ribs and bosses | Thickness transitions cause differential shrinkage and sink risk |
Dimensions at or near these locations require extra scrutiny when assigning Cpk requirements. Placing a CTQ dimension at the end of a long flow path physically constrains achievable Cpk — a fact worth surfacing before tolerances are locked.
Documenting Critical Dimensions Before Tooling
CTQ dimensions must be explicitly called out on the drawing or PPAP control plan with their Cpk target — typically 1.33 for new processes, sometimes 1.67 for medical or high-volume automotive. Align on this list before tooling is cut. Retroactively tightening Cpk requirements after steel is built is one of the most common and costly sources of project delays.
AIAG PPAP guidelines require that all Key Product Characteristics (KPCs) flow from Design FMEA to Process FMEA to Control Plan. If a CTQ dimension isn't traceable through that chain before first steel, it won't have the process controls in place to validate — and you'll be scrambling after T1 samples to catch up.
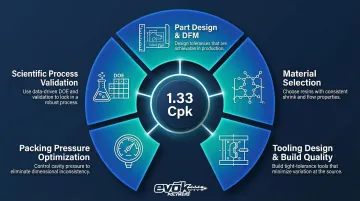
The Five Process Levers for Achieving 1.33 Cpk
Lever 1—Part Design and DFM
Wall thickness uniformity, flow length-to-thickness (L/T) ratio, and gate proximity to critical dimensions directly impact shot-to-shot consistency. Designs requiring plastic to flow long distances before reaching a CTQ dimension—or placing critical features in thin-wall sections—limit achievable Cpk.
Key design factors:
- Keep L/T ratios within resin-specific limits to avoid pressure-limited processes
- Maintain uniform wall thickness to prevent differential cooling and warpage
- Position gates near critical dimensions to maximize packing pressure effectiveness
- Avoid placing CTQ features at end-of-fill or across weld lines
Early DFM review—before tooling—is the most cost-effective way to protect Cpk targets. Once steel is cut, structural design issues become exponentially more expensive to correct.
Lever 2—Material Selection
Materials with lower shrink rates produce less absolute dimensional variation. Amorphous resins like ABS (0.4–0.8% shrinkage) shrink less and more uniformly than semicrystalline resins like polypropylene (1.0–3.0% shrinkage). Filled or reinforced materials generally shrink less but introduce anisotropy—glass fibers align with flow, restricting longitudinal shrinkage while allowing transverse shrinkage.
Material impact on capability:
- A 10-inch part in PP (1.5% shrink) will vary significantly more than the same part in ABS (0.6% shrink)
- 30% glass-filled PP exhibits highly directional shrinkage requiring complex windage adjustments
- Higher absolute dimensions amplify shrinkage variation—material choice has amplified impact on large or tightly toleranced features
Use primary manufacturer Technical Data Sheets (TDS) and 3D mold-flow simulation to apply directional shrinkage to tooling, not generic shrink factors.
Lever 3—Tooling Design and Build Quality
Gate location, vent adequacy, cooling line layout, and shutoff quality determine process window width. A tight process window—where parts start to flash before reaching optimal pack pressure—forces compromises that cap achievable Cpk.
Critical tooling factors:
- Gate location must balance flow length, shear heating, and pack pressure delivery to CTQ dimensions
- Adequate venting prevents trapped air from causing hesitation, burn marks, or incomplete fill
- Balanced cooling prevents differential shrinkage and warpage
- High-quality shutoffs prevent flash while allowing sufficient pack pressure
Mold flow analysis during tool design simulates fill and pack behavior at critical dimensions before steel is cut, identifying potential issues when they're still inexpensive to fix. Evok Polymers runs mold flow simulation on every production tool, using gate placement and cooling layout to target dimensional stability at CTQ features before any steel is cut.
Lever 4—Packing Pressure Optimization
Higher packing pressure reduces shot-to-shot weight variation, which tightens dimensional output. At higher pack weights, cavity mass stabilizes shot to shot, reducing variability.
Pressure-limited processes—where fill pressure approaches machine limits before parts are fully packed—prevent reaching 1.33 Cpk and must be addressed at the design or tooling stage.
Beyond standard process control, cavity pressure sensing takes this further. Standard Decoupled II molding relies on machine pressure, which cannot compensate for lot-to-lot resin viscosity variations. Decoupled III methodology places a sensor near the gate, packing at controlled velocity until a specific in-cavity pressure is reached, then transferring to hold. The result: identical pressure shot after shot, absorbing viscosity variation and measurably improving Cpk.
Lever 5—Scientific Process Validation
Run a systematic Design of Experiments (DOE) or process window study during mold qualification to establish parameters that consistently yield the lowest dimensional variation. Response Surface Methodology (RSM) models the relationship between process factors (melt temp, mold temp, injection speed, pack pressure) and dimensional responses, optimizing settings before parts ship.
Paul Dathe, Evok's founder, holds a Six Sigma Black Belt and applies scientific molding methods from day one of mold qualification. Across 25 years of programs in automotive, medical, and powersports, that approach has consistently reduced the iteration cycles required to achieve and document 1.33 Cpk—so capability is established before production release, not discovered after.
Inspection Tools and Sample Size Planning for Critical Dimensions
Common Measurement Tools for Critical Dimensions
| Tool | Best For | Considerations |
|---|---|---|
| CMM (Coordinate Measuring Machine) | Tight tolerances, complex 3D geometry | High accuracy, slower throughput |
| Digital calipers and micrometers | Straightforward linear dimensions | Fast, lower cost, operator-dependent |
| Optical comparators | Thin or delicate features | Non-contact, good for profiles |
| Vision systems | High-volume in-line inspection | Fast, automated, requires programming |
All equipment used for Cpk measurement must have a validated Measurement System Analysis (MSA/Gage R&R). AIAG MSA 4th Edition specifies that measurement error should typically be under 10–30% of the tolerance band, with systems under 10% considered acceptable and over 30% unacceptable; the system must also divide the process output into at least 5 distinct categories (ndc).
Minimum Sample Size Requirements
The standard for initial process qualification (PPAP) is 30 consecutive parts per cavity, measured under a locked process. Fewer samples produce unreliable Cpk estimates and can falsely indicate capability where none exists.
Multi-cavity tools require per-cavity Cpk analysis — each cavity is a unique process. Key reasons to analyze cavities individually:
- Shear imbalances and thermal gradients produce distinct dimensional outputs per cavity
- Tooling wear affects cavities unevenly over time
- Combined data creates a bimodal distribution that can mask a non-capable cavity within an averaged result
AIAG PPAP explicitly requires parts from each cavity position to be measured separately.
Short-Term Cpk vs. Long-Term Ppk
How you sample directly affects which statistic you should report. Cpk uses within-subgroup standard deviation and represents short-term capability from a single qualification run, reflecting within-run variation. Ppk uses overall standard deviation and captures run-to-run variation over time, including shifts and drifts.
Most OEM quality requirements specify 1.33 Cpk at qualification as the entry point, with ongoing SPC monitoring to detect drift before defects reach customers.
When Cpk Falls Short of 1.33: Root Causes and Corrective Actions
Diagnostic Framework: Centering vs. Spread
First determine whether the distribution is centered:
- Cp ≥ 1.33 but Cpk < 1.33: Centering problem. The process is repeatable but biased toward one spec limit. Addressable by process adjustment (pack pressure, hold time) or tooling modification (windage adjustment).
- Cp < 1.33: Spread too wide. Structural variation problem requiring design, tooling, or material changes. Process adjustments alone will not fix this.
Once you've identified which scenario applies, the table below maps structural root causes to targeted corrective actions.
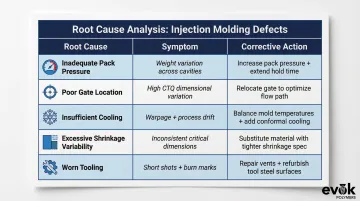
Common Structural Root Causes and Corrections
| Root Cause | Symptom | Corrective Action |
|---|---|---|
| Inadequate pack pressure | High shot-to-shot weight variation | Increase pack pressure; extend hold time until gate seal |
| Poor gate location | High variation at CTQ dimensions far from gate | Relocate gate closer to critical features; add gates if needed |
| Insufficient cooling | Post-mold dimensional drift, warpage | Balance mold temperatures; add conformal cooling channels |
| Excessive material shrinkage variability | Inconsistent dimensions despite stable process | Substitute lower-shrink or filled material; validate with TDS data |
| Worn or inadequately vented tooling | Hesitation, short shots, burn marks | Repair vents; refurbish steel; validate shutoff surfaces |
When the Tolerance Is Unrealistic
Some Cpk failures indicate the tolerance specified on the drawing exceeds what injection molding can reliably achieve. While ASME Y14.5 is authoritative for GD&T language, it lacks plastics-specific material behavior. Evaluating Cpk against metal-machining tolerances virtually guarantees failure.
Reference the Plastics Industry Association's AQ-102 standards to establish realistic, achievable tolerance bands during DFM before demanding 1.33 Cpk from the molder. The right fix is a tolerance/process alignment conversation between designer and molder — not pushing process parameters past what the material and tool can physically deliver.
Frequently Asked Questions
What is Cpk in injection molding?
Cpk (Process Capability Index) is a statistical measure of how well an injection molding process consistently produces parts within specified dimensional tolerances. It accounts for both process spread and centering relative to the specification limits — giving you a quantitative prediction of defect rates at production scale.
What are acceptable Cp and Cpk values in injection molding?
1.33 is the standard minimum Cpk for critical dimensions at production launch, providing a ~63 PPM defect rate. 1.67 is required for safety-critical or medical applications (~0.54 PPM). Values below 1.00 indicate the process cannot reliably hold the specified tolerance and require corrective action or 100% inspection.
What is the difference between Cp and Cpk in injection molding?
Cp measures whether the process spread is narrow enough to theoretically fit within the tolerance band, assuming perfect centering. Cpk also accounts for how well the process is centered—a process can have high Cp but low Cpk if it's consistently biased toward one spec limit due to off-center tooling or inadequate packing.
How many samples are needed to calculate Cpk for injection molded parts?
A minimum of 30 consecutive parts per cavity is the standard for a statistically valid short-term Cpk study. Multi-cavity tools require separate analysis per cavity — averaging results across cavities can mask a single non-capable cavity.
When is a Cpk of 1.67 required instead of 1.33?
1.67 is the standard initial qualification target for safety-critical dimensions in medical devices, automotive, and other high-reliability applications. It also accounts for long-term run-to-run process drift. The result is a 5-sigma buffer (~0.54 PPM defect rate) versus the 4-sigma buffer (~63 PPM) of 1.33 Cpk.